In 2021, Google started using Core Web Vitals as ranking signals. Since then, these three metrics have become the standard way to measure real-world user experience on the web. They are no longer optional considerations — they directly influence your search visibility, your bounce rate, and ultimately your revenue.
This guide breaks down each metric, explains what it measures, provides concrete thresholds, and gives you actionable techniques to improve your scores. No theory for the sake of theory — just practical steps you can implement today.
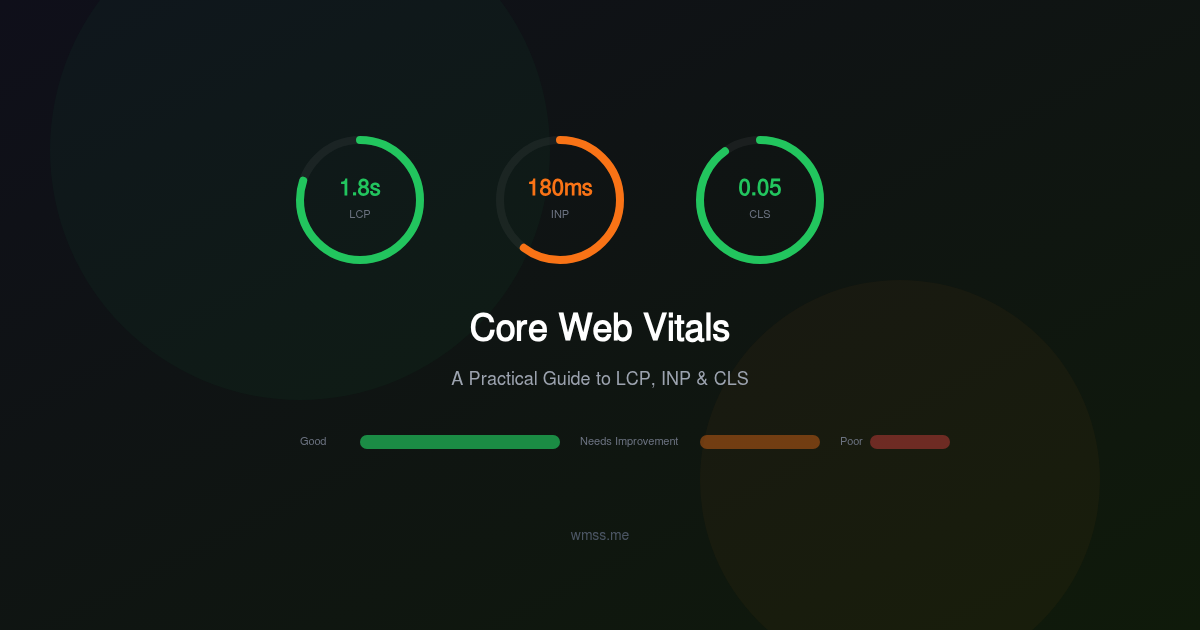
What Are Core Web Vitals?
Core Web Vitals are three specific metrics that Google considers essential to a good user experience:
- LCP (Largest Contentful Paint) — How quickly the main content loads
- INP (Interaction to Next Paint) — How quickly the page responds to user input
- CLS (Cumulative Layout Shift) — How visually stable the page is during loading
Google evaluates these metrics using real-world data from Chrome users (the Chrome User Experience Report, or CrUX). This means lab scores from Lighthouse are useful for debugging, but your actual ranking impact depends on field data from real visitors.
The Thresholds
| Metric | Good | Needs Improvement | Poor | |--------|------|-------------------|------| | LCP | ≤ 2.5s | 2.5s – 4.0s | > 4.0s | | INP | ≤ 200ms | 200ms – 500ms | > 500ms | | CLS | ≤ 0.1 | 0.1 – 0.25 | > 0.25 |
Google uses the 75th percentile of page loads. This means 75% of your visitors must experience values within the "Good" threshold for your page to pass.
LCP: Largest Contentful Paint
LCP measures how long it takes for the largest visible element in the viewport to render. This is usually a hero image, a large heading, or a video poster frame. It represents the moment when the user perceives that the main content has loaded.
What Affects LCP
Four factors contribute to slow LCP:
- Slow server response time (TTFB): The browser cannot start rendering until it receives the first byte of HTML.
- Render-blocking resources: CSS and synchronous JavaScript in the
<head>delay rendering. - Slow resource loading: Large images, unoptimized fonts, or resources loaded from slow CDNs.
- Client-side rendering: JavaScript frameworks that render content after page load push LCP later.
How to Improve LCP
Reduce TTFB
- Use a CDN to serve content from edge locations close to your users.
- Enable server-side caching (Redis, Varnish, or application-level caching).
- Optimize database queries that block the initial HTML response.
- Upgrade to HTTP/2 or HTTP/3 for multiplexed connections.
Eliminate Render-Blocking Resources
- Defer non-critical JavaScript with
deferorasyncattributes. - Inline critical CSS and load the rest asynchronously.
- Reduce the total size of CSS files — remove unused rules.
Optimize the LCP Element
- If the LCP element is an image, use
<link rel="preload" as="image" href="hero.webp">in the<head>. - Serve images in modern formats (WebP, AVIF) with responsive
srcset. - Set explicit
widthandheightattributes to reserve space. - Never lazy-load the LCP image — it should load eagerly.
Avoid Client-Side Rendering for Above-the-Fold Content
- Use server-side rendering (SSR) or static generation for the initial HTML.
- If using a JavaScript framework, ensure the LCP element is in the server-rendered HTML, not injected by JavaScript after hydration.
INP: Interaction to Next Paint
INP replaced First Input Delay (FID) as a Core Web Vital in March 2024. While FID only measured the delay of the first interaction, INP measures the responsiveness of all interactions throughout the page lifecycle and reports the worst one (at the 98th percentile).
An "interaction" is a click, tap, or keyboard input. INP measures the time from the user's input to the moment the browser presents the next visual update (the next frame).
What Affects INP
- Long JavaScript tasks: Any task that occupies the main thread for more than 50ms prevents the browser from responding to user input.
- Excessive JavaScript execution: Large bundles, unnecessary polyfills, or third-party scripts consume processing time.
- Layout thrashing: Reading and writing DOM properties in a loop forces the browser to recalculate layout repeatedly.
- Heavy event handlers: Click or input handlers that perform expensive computations synchronously.
How to Improve INP
Break Up Long Tasks
- Use
requestAnimationFrameorsetTimeoutto yield to the main thread between processing steps. - The
scheduler.yield()API (now available in modern browsers) is the preferred way to yield control. - Move heavy computation to Web Workers.
Reduce JavaScript Payload
- Audit your bundles with tools like Webpack Bundle Analyzer or source-map-explorer.
- Remove unused dependencies. Tree-shaking only works if dependencies support ES modules.
- Lazy-load components and routes that are not needed on initial render.
- Load third-party scripts (analytics, chat widgets, social embeds) after the page is interactive.
Optimize Event Handlers
- Debounce or throttle handlers for rapid-fire events (scroll, resize, input).
- Avoid synchronous layout reads inside event handlers — batch reads before writes.
- Use CSS transitions and animations instead of JavaScript-driven animations where possible.
Minimize DOM Size
- Pages with more than 1,500 DOM nodes experience slower style recalculation and layout.
- Virtualize long lists (render only visible items).
- Simplify deeply nested HTML structures.
CLS: Cumulative Layout Shift
CLS measures visual stability. It quantifies how much visible content unexpectedly shifts during the page's lifespan. A score of 0 means nothing moved; higher scores indicate more jarring layout shifts.
Layout shifts are frustrating. You are about to click a link, and suddenly an ad loads above it, pushing the link down. You click the wrong thing. CLS captures exactly this kind of experience.
What Causes Layout Shifts
- Images and videos without dimensions: When the browser does not know the size of a media element in advance, it allocates zero space until the resource loads, then shifts everything around it.
- Late-loading content: Ads, embeds, cookie consent banners, or dynamically injected elements that push existing content down.
- Web fonts causing FOIT/FOUT: When a web font loads and replaces a fallback font with different metrics, text reflows and shifts surrounding elements.
- Dynamic content above existing content: Notifications, banners, or alerts inserted at the top of the page.
How to Fix CLS
Always Set Dimensions for Media
- Add
widthandheightattributes to every<img>and<video>tag. - Use CSS
aspect-ratiofor responsive containers:aspect-ratio: 16/9. - Reserve space for ad slots with fixed-size placeholder containers.
Preload Web Fonts
- Use
<link rel="preload" as="font" type="font/woff2" href="font.woff2" crossorigin>. - Set
font-display: swapin your@font-facedeclarations. - Use
size-adjust,ascent-override, anddescent-overridein CSS to match fallback font metrics to your web font, eliminating reflow.
Avoid Inserting Content Above Existing Content
- If you need to show a notification or banner, use a fixed-position overlay instead of pushing content down.
- Load cookie consent banners in a fixed position (bottom or top of the viewport).
Use contain CSS Property
- Apply
contain: layoutto elements that may change size independently, preventing their changes from affecting siblings.
Measuring Core Web Vitals
Lab Tools (Simulated Environment)
- Chrome DevTools Performance panel: Record a page load and inspect LCP, CLS, and long tasks.
- Lighthouse: Provides scores and specific recommendations. Available in DevTools, as a CLI, and via PageSpeed Insights.
- WebPageTest: Advanced waterfall analysis with filmstrip view.
Field Tools (Real User Data)
- Chrome User Experience Report (CrUX): Real-world data from Chrome users, available via BigQuery and the CrUX API.
- PageSpeed Insights: Shows both lab and field data for any URL.
- web-vitals JavaScript library: Instrument your site to collect CWV data from your own visitors.
Automated Monitoring with WMSS
WMSS measures Core Web Vitals as part of its comprehensive performance audit using a real headless Chrome browser. Unlike synthetic Lighthouse runs, WMSS provides consistent, repeatable measurements you can track over time.
Each audit captures LCP, INP-readiness signals, and CLS along with specific recommendations to improve each metric. The performance section of your WMSS report shows exactly which elements are the LCP candidates, which scripts block interactivity, and which elements cause layout shifts.
Real-World Optimization Tips
-
Prioritize LCP first. It has the biggest perceived impact on user experience and is usually the easiest to improve with image optimization and preloading.
-
Measure before and after every change. A "performance improvement" without measurement is just a guess. Use WMSS to establish baselines and verify improvements.
-
Focus on the 75th percentile. Your slowest 25% of users are on slow connections or old devices. Optimizing for them often means reducing payload size, which benefits everyone.
-
Test on real devices. Your development machine does not represent your users. Test on mid-range Android phones with throttled connections.
-
Beware third-party scripts. Analytics, chat widgets, A/B testing tools, and social embeds are often the biggest contributors to poor INP and LCP. Audit their impact regularly and defer what you can.
Track Your Progress
Core Web Vitals optimization is not a one-time project — it is an ongoing practice. New features, content updates, and third-party script changes can regress your scores at any time.
Set up regular automated audits with WMSS to catch regressions early. Compare your scores over time, identify trends, and ensure your site consistently delivers the fast, stable experience that both users and Google demand.