External uptime monitoring tells you whether your website responds. It does not tell you why it stopped responding, or more importantly, that it is about to stop responding. For that, you need eyes inside the server.
Traditional server monitoring solutions require installing agents, configuring daemons, opening firewall ports, and often root access. For teams on shared hosting, managed servers, or locked-down environments, these requirements are deal-breakers. Even on servers where you have full control, the overhead of deploying and maintaining monitoring agents across a fleet is significant.
There is a simpler approach: a single PHP file that runs on your web server, collects system metrics, and reports them to your monitoring platform. No root access. No daemon installation. No open ports. Just one file in your web root, authenticated with an API key.
Why External Checks Are Not Enough
External monitoring checks your website from the outside. It sends an HTTP request and verifies the response. This is essential — but it has blind spots:
-
It cannot see resource exhaustion. Your server might be at 95% CPU usage, handling requests slowly but not yet failing. External monitoring sees "200 OK with 4-second response time." By the time it sees a 503, the damage is done.
-
It cannot predict failures. A disk filling up at 2GB per day will cause a crash in 48 hours. External monitoring will not alert you until the disk is full and MySQL crashes because it cannot write temporary tables.
-
It cannot identify the root cause. When your site goes down, external monitoring tells you it is down. It does not tell you whether the cause is high CPU, out-of-memory, a crashed MySQL process, a full disk, or a runaway PHP process.
-
It misses silent failures. Redis might crash without affecting your website immediately (if you have fallback logic), but your sessions and cache are now gone. A cron job might have stopped running three days ago. External monitoring sees none of this.
Server-side monitoring fills these gaps by collecting metrics from inside the machine and reporting them before they become outages.
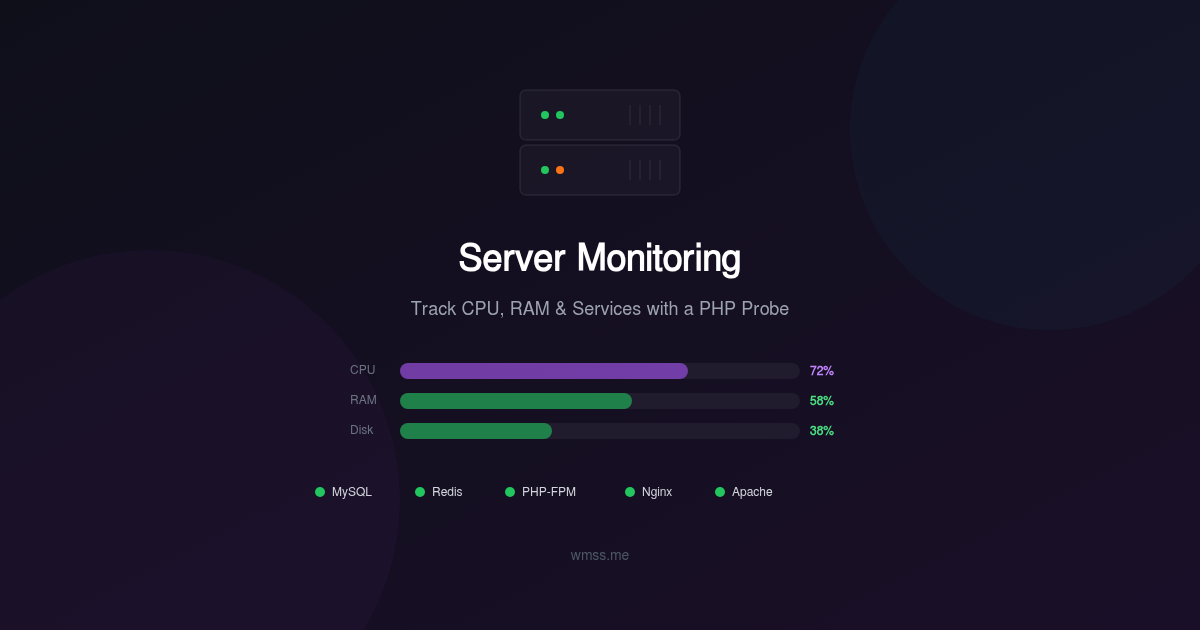
What a PHP Probe Can Monitor
A well-designed PHP probe collects system-level metrics by reading from /proc, running system utilities, and checking process tables. Here is what it can track:
CPU Load
The probe reads load averages from /proc/loadavg — the 1-minute, 5-minute, and 15-minute load averages. Combined with the number of CPU cores (from /proc/cpuinfo), it calculates the load percentage and detects sustained high CPU usage.
A load average above the number of cores means tasks are queuing for CPU time. Sustained high load degrades response times and eventually causes timeouts.
Memory Usage
Reading from /proc/meminfo, the probe reports total memory, used memory, available memory, and swap usage. Memory trends are critical for detecting leaks — a PHP process that slowly consumes more memory over days will eventually trigger the OOM killer, crashing your application.
The probe also tracks buffer and cache usage separately. Linux uses free memory for disk caching, so "used memory" alone can be misleading. The MemAvailable metric from the kernel gives the accurate picture.
Disk Usage
Using PHP's disk_total_space() and disk_free_space() functions, the probe monitors disk utilization for each mount point. More importantly, it tracks the rate of change — if your disk is 70% full and growing by 3% per day, you have about 10 days before it is full. That prediction is far more valuable than a simple "disk is 70% full" alert.
Disk space issues are among the most common causes of website crashes. MySQL cannot write temporary tables, PHP cannot write sessions, log files fill up, and the application dies with cryptic errors.
Service Detection
The probe checks whether critical services are running by scanning the process table and testing connections:
- MySQL / MariaDB: Verifies the process is running and optionally tests a connection.
- Redis: Checks the process and sends a PING command.
- PHP-FPM: Verifies the pool manager process is active and checks the number of worker processes.
- Apache / Nginx: Confirms the web server process is running.
- Memcached: Tests the connection with a stats command.
- Elasticsearch: Checks the process and HTTP health endpoint.
When a service disappears, the probe reports it immediately — not minutes later when the first user hits an error page.
Process Monitoring
Beyond standard services, you can configure the probe to watch for specific processes. A background worker that processes payment webhooks. A video encoding daemon. A custom data sync script. If the process stops, you know immediately.
Error Log Scanning
The probe can tail recent entries from PHP error logs, application logs, and system logs, reporting critical errors, fatal exceptions, and OOM events. This provides early warning of issues that have not yet caused visible symptoms.
How the WMSS Probe Works
The WMSS probe takes this concept and packages it into a production-ready solution. Here is how it works:
One File, Zero Dependencies
The WMSS probe is a single PHP file (wmss-probe.php) that you upload to your web root. It has no external dependencies — no Composer packages, no compiled extensions, no configuration files. It runs on any server with PHP 7.4 or higher.
No Agent Installation
Unlike traditional monitoring solutions that require:
- Root access to install packages
- Systemd service configuration
- Firewall rules for inbound connections
- Separate update and maintenance workflows
The WMSS probe is just a PHP file served by your existing web server. Upload it, configure the API key, and it is operational.
No Root Access Required
The probe reads from /proc and uses standard PHP functions — it runs with the same permissions as your web application. No sudo, no setuid, no privilege escalation. If PHP can read it, the probe can report it.
Secure Authentication
Every request to the probe is authenticated with an API key unique to your site. The probe rejects any request without a valid key. No data is exposed to unauthorized users, and the probe's endpoint is not discoverable through normal browsing.
Orchestrated Collection
The WMSS platform orchestrates data collection by sending authenticated requests to your probe on a regular schedule. The probe executes the requested checks, collects the data, and returns a structured JSON response. The platform stores, analyzes, and visualizes the results.
This pull-based architecture means the probe never initiates outbound connections. It sits passively until the WMSS platform requests data, making it compatible with the strictest firewall configurations.
Predictive Alerts
Raw metrics are informative. Predictive alerts are actionable.
Disk Full Prediction
Instead of alerting when disk usage crosses 90%, WMSS calculates the rate of disk consumption and predicts when the disk will be full. An alert that says "Disk will be full in 3 days at the current rate" gives you time to investigate, clean up, or expand storage before any impact.
Memory Leak Detection
By tracking memory usage patterns over time, the platform identifies processes with steadily increasing memory consumption. A PHP-FPM worker pool that gains 50MB of memory every hour is a memory leak that will eventually crash the server. Early detection lets you restart the workers or fix the underlying code before the OOM killer strikes.
Service Degradation Trends
Response times from your services (MySQL query time, Redis latency, PHP-FPM pool utilization) are tracked over time. Gradual increases indicate developing problems — a growing database table causing slower queries, or increased traffic pushing PHP-FPM pools toward their limits.
Custom Monitors
Every server environment is unique. The WMSS probe supports custom monitoring configurations:
Process Monitoring
Specify process names to watch. The probe checks the process table and reports whether each configured process is running, along with its CPU and memory consumption.
Monitored processes: php-worker, payment-sync, video-encoder
Port Monitoring
Verify that specific TCP ports are open and accepting connections. Useful for custom services, internal APIs, or non-standard database ports.
Monitored ports: 6379 (Redis), 11211 (Memcached), 9200 (Elasticsearch)
Custom Handlers
For advanced use cases, you can add custom data collection handlers that the probe executes alongside the standard checks. This lets you monitor application-specific metrics — queue depth, cache hit ratio, active user sessions, or business-level KPIs.
Data Retention and Aggregation
Raw metric data at one-minute resolution accumulates quickly. The WMSS platform implements a tiered retention strategy:
- Last 24 hours: Full resolution (every data point)
- Last 7 days: 5-minute aggregation (min, max, avg)
- Last 30 days: 1-hour aggregation
- Beyond 30 days: Daily aggregation for long-term trend analysis
This approach provides high-resolution data for recent incident investigation while maintaining long-term trends for capacity planning, without requiring excessive storage.
Historical data enables you to answer questions like: "Is CPU usage higher this month than last month?" or "What was our average disk growth rate over the last quarter?"
Getting Started with WMSS Server Monitoring
Setting up server monitoring with the WMSS probe takes under five minutes:
- Add your site at wmss.me if you have not already.
- Generate your probe from the site dashboard. WMSS generates a customized PHP file with your unique API key embedded.
- Upload the probe to your web root via FTP, SCP, or your hosting control panel.
- Verify the connection from the WMSS dashboard. The platform sends a test request to confirm the probe is reachable and authenticated.
- Configure your monitors: Select which services to watch, set alert thresholds, and configure notification channels.
From that point, WMSS collects data from your probe on a regular schedule, processes the metrics, and alerts you when thresholds are crossed or when predictive analysis indicates a developing problem.
You get a server dashboard showing real-time CPU, memory, disk, and service status alongside your website audit results and uptime monitoring. One platform, complete visibility.
Conclusion
External monitoring tells you your site is down. Server monitoring tells you why and warns you before it happens. The WMSS probe gives you server-level visibility without the complexity of traditional monitoring agents — no root access, no daemon installation, no firewall changes.
A single PHP file, an API key, and five minutes of setup stand between you and complete server observability. Visit wmss.me to get started.