Your website went down last Tuesday at 3 AM. It stayed down for four hours. Nobody noticed until a customer complained on social media at 9 AM. By then, you had lost overnight orders, your search rankings had taken a hit, and your credibility was damaged.
This scenario plays out daily across thousands of businesses. The fix is simple, inexpensive, and takes minutes to set up: uptime monitoring. Yet an alarming number of websites operate without it, relying on users to report problems — the most expensive and embarrassing form of incident detection.
The Real Cost of Downtime
Downtime is not just a technical inconvenience. It has measurable financial and reputational consequences.
Direct Revenue Loss
For e-commerce sites, the math is straightforward. If your site generates $10,000 per day, every hour of downtime costs you roughly $417. For SaaS platforms, the impact compounds: customers cannot log in, workflows break, and trial users abandon your product permanently.
Even for content and lead-generation sites, downtime means missed form submissions, lost ad impressions, and visitors who find a competitor and never return.
SEO Impact
Google's crawlers visit your site regularly. If Googlebot encounters a 5xx error during a crawl, it notes the failure. Repeated failures cause Google to reduce crawl frequency and eventually deindex pages. Studies have shown that extended downtime (more than a few hours) can drop rankings for weeks, even after the site recovers.
Trust and Brand Damage
Users have zero tolerance for unreliable websites. A study by Google found that 53% of mobile users abandon a page that takes longer than 3 seconds to load. A complete outage is infinitely worse. One bad experience creates a lasting negative impression, and negative experiences are shared more often than positive ones.
SLA Violations
If you offer a Service Level Agreement to your clients (common for agencies, SaaS, and managed hosting), downtime triggers financial penalties. Without monitoring, you may not even know you have breached your SLA until the client presents the invoice.
What Uptime Monitoring Checks
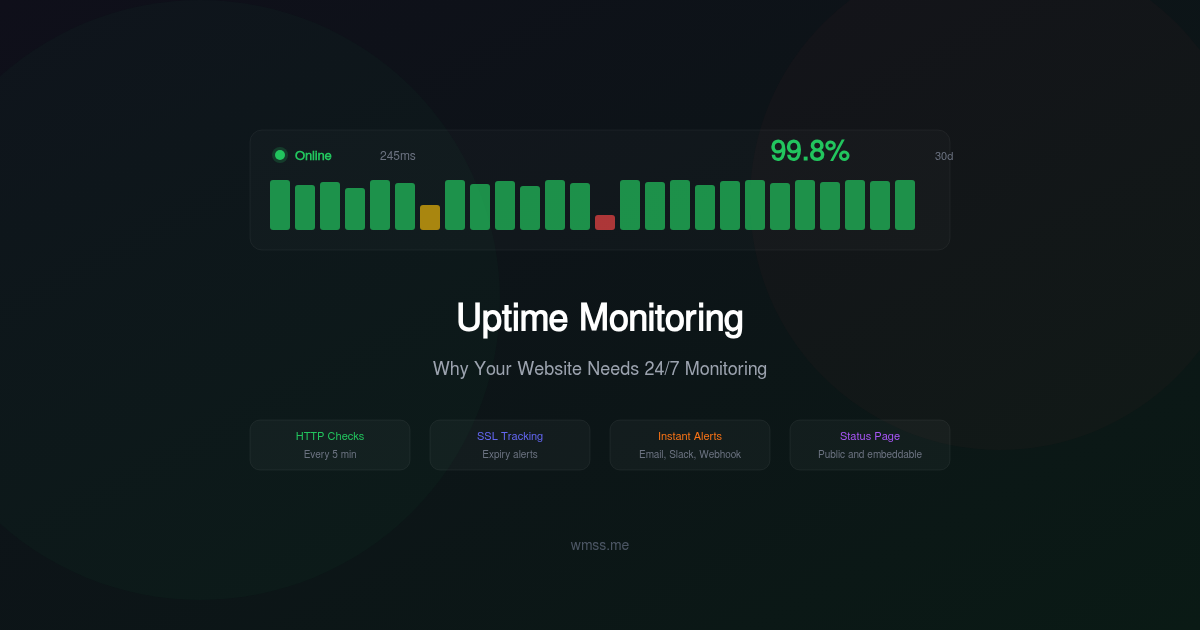
Modern uptime monitoring goes far beyond simply pinging a server. Here is what a comprehensive monitoring setup evaluates:
HTTP Status Monitoring
The most fundamental check: send an HTTP request to your URL and verify it returns a 200 OK status. If the server returns a 5xx error, a 4xx error, or times out, an alert is triggered.
Advanced HTTP monitoring also verifies:
- Response time: Not just whether the site responds, but how quickly. A site that responds in 15 seconds is technically "up" but effectively broken.
- Specific status codes: You might want to alert on 301 redirects (unexpected), 403 forbidden (access issues), or 503 service unavailable (maintenance mode left on).
SSL Certificate Monitoring
SSL certificates expire. When they do, browsers display frightening security warnings that send visitors running. SSL monitoring checks your certificate's expiry date and alerts you days or weeks in advance, giving you time to renew before users are impacted.
It also verifies the certificate chain is valid, the certificate matches your domain, and the server supports modern TLS versions.
Keyword Monitoring
A server can return a 200 status code while serving completely broken content — a blank page, an error message from your application framework, or a cached maintenance page from your CDN. Keyword monitoring checks that specific text exists (or does not exist) in the response body.
For example, verify that your homepage contains your brand name, or alert if the response contains "Error establishing a database connection."
Response Time Tracking
Even when your site is technically up, slow response times degrade user experience and SEO. Continuous response time tracking lets you identify gradual performance degradation — a database slowly filling up, a memory leak growing over days, or a CDN node having regional issues.
Types of Monitoring
HTTP(S) Monitoring
The standard check. Sends a GET or HEAD request to a URL and validates the response status, time, and optionally the body content. Suitable for websites, APIs, and web applications.
TCP Port Monitoring
Verifies that a specific port is open and accepting connections. Useful for monitoring databases (port 3306), mail servers (port 25/587), FTP servers (port 21), and custom services.
Ping (ICMP) Monitoring
The most basic check — verifies the server is reachable at the network level. Useful for detecting hardware failures or network outages, but does not verify that your application is actually working.
SSL Certificate Monitoring
Dedicated checks for certificate validity, expiry, and chain completeness. Should alert at 30, 14, and 7 days before expiry.
Keyword Monitoring
Validates that specific content is present (or absent) in the response. Essential for catching application-level failures that return 200 status codes with error content.
Alert Channels
Detecting downtime is useless if nobody sees the alert. Effective monitoring provides multiple notification channels:
- Email: The baseline. Every monitoring service supports it. But email has latency — you might not see it for hours.
- Slack / Discord / Microsoft Teams: Instant visibility in team channels. Great for development teams that live in chat.
- SMS: Hard to miss. Best reserved for critical alerts to avoid alert fatigue.
- Webhooks: Send alerts to any service — PagerDuty, Opsgenie, custom dashboards, or your own incident management system.
- Push notifications: Mobile app notifications for on-the-go awareness.
The key is to configure escalation: start with Slack for the first alert, escalate to SMS after 5 minutes if unacknowledged, and notify management after 15 minutes.
Public Status Pages
A public status page (like status.yourcompany.com) serves two purposes:
-
Transparency: When an incident occurs, users check your status page before flooding your support channels. A clear status page with real-time updates reduces support tickets dramatically.
-
Trust: Maintaining a public status page signals professionalism. It tells customers you take reliability seriously and communicates honestly about incidents.
A good status page shows:
- Current status of each service component
- Active incidents with real-time updates
- Historical uptime percentage (90-day rolling)
- Scheduled maintenance windows
- Incident history with resolution notes
Maintenance Windows
Not all downtime is unplanned. Server updates, database migrations, and infrastructure changes require scheduled downtime. Without maintenance windows in your monitoring system, these planned outages trigger false alerts and pollute your uptime statistics.
Maintenance windows let you:
- Suppress alerts during scheduled work
- Exclude planned downtime from uptime calculations
- Notify subscribers in advance via the status page
- Document the maintenance reason for audit trails
Incident Management
When downtime occurs, you need more than just an alert. You need a structured process:
- Detection: Automated monitoring detects the issue within seconds.
- Alert: The right people are notified through the right channels.
- Acknowledgment: Someone takes ownership of the incident.
- Investigation: The team identifies the root cause.
- Resolution: The issue is fixed and the site is verified.
- Post-mortem: Document what happened, why, and how to prevent it.
Root cause notes attached to each incident create an invaluable knowledge base. Over time, patterns emerge: most outages happen during deployments, or after a specific cron job runs, or when traffic spikes on Tuesdays. This data drives infrastructure improvements.
How WMSS Handles All of This
WMSS provides comprehensive uptime monitoring as part of its website audit platform. Here is what you get:
- HTTP(S) monitoring with configurable check intervals (1-minute checks on paid plans)
- SSL certificate monitoring with advance expiry warnings
- Keyword verification to catch application-level failures
- Response time tracking with historical charts and trend analysis
- Multi-channel alerts: email, Slack, and webhook integrations
- Public status pages with custom branding for agency and enterprise plans
- Maintenance windows to prevent false alerts during planned work
- Incident history with root cause notes and resolution tracking
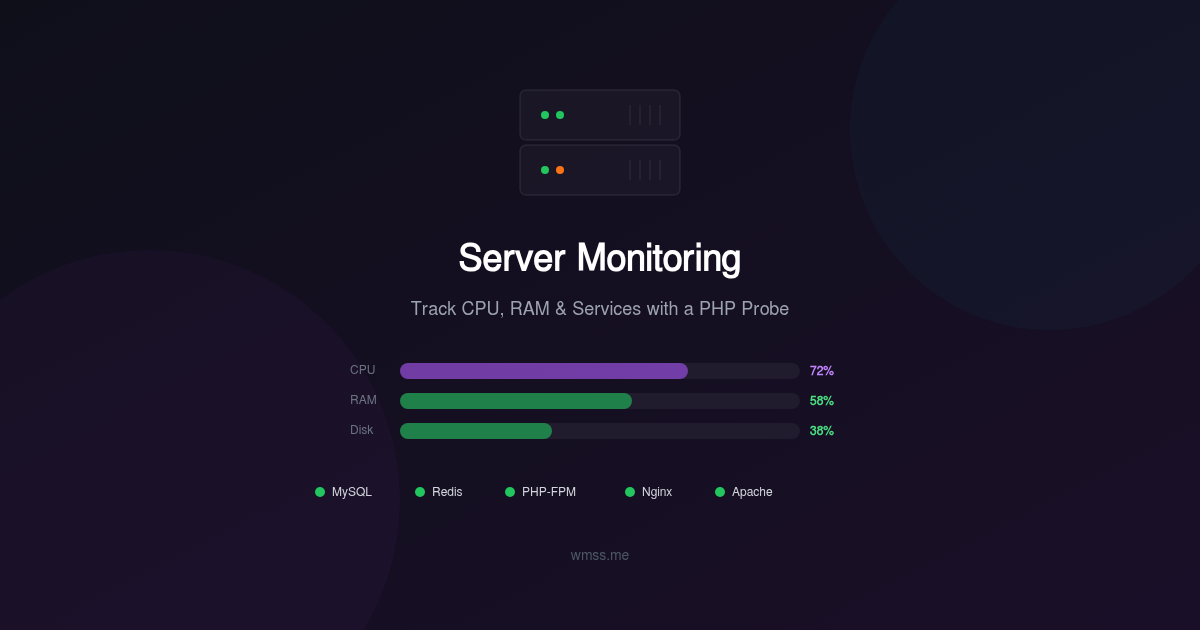
- Server monitoring via the WMSS probe for CPU, RAM, disk, and service health
Everything integrates with the same dashboard where you run your website audits, so you get a complete view of your site's health in one place.
Getting Started
Setting up uptime monitoring takes less than five minutes:
- Add your website at wmss.me
- Configure your checks: Select HTTP monitoring, set the check interval, and optionally add keyword verification
- Set up alerts: Connect your Slack workspace, add email recipients, or configure a webhook
- Enable SSL monitoring: Add your domain and set expiry warning thresholds
- Create your status page: Customize the branding and share the URL with your users
From that point, WMSS monitors your site around the clock. You get instant alerts when something goes wrong, detailed response time analytics to spot trends, and the peace of mind that comes from knowing you will always be the first to know about an issue — not your customers.
Your website's availability is the foundation everything else is built on. Without it, your SEO efforts, your marketing campaigns, and your conversion optimization are all irrelevant. Start monitoring today.